Click an image to view the full file.
These artifacts were created by garnering insights from survey data, reports from the analytics team, and personally walking through the experiences to find additional pain points.
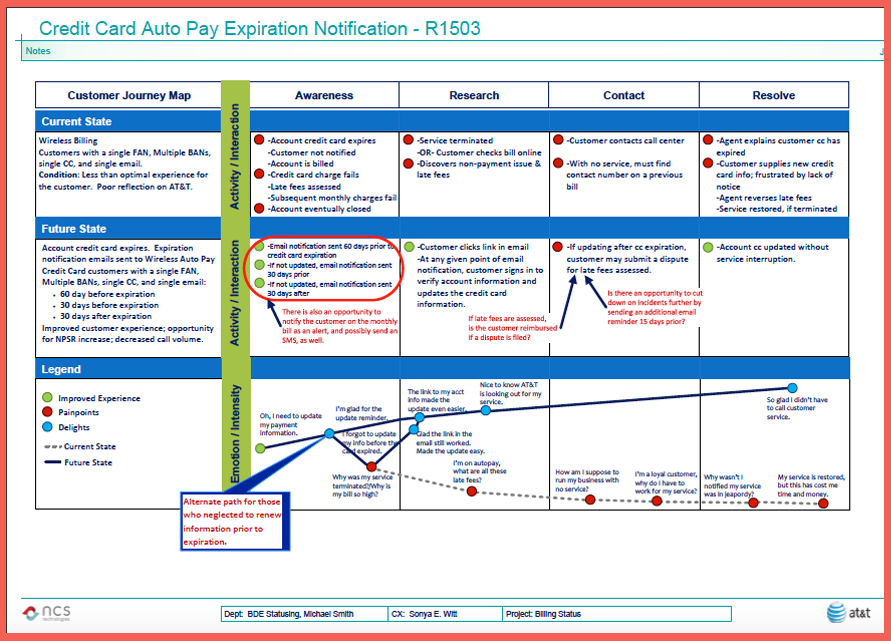
Created in Excel for AT&T. It shows the how the customer goes through a particular flow and where improvements need to be made.
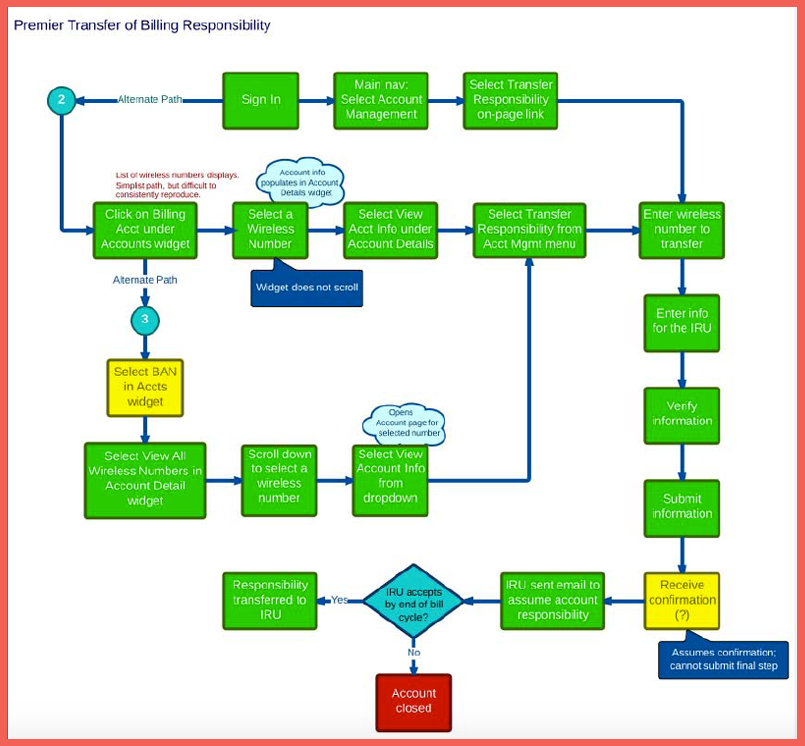
Created in MindMeister for AT&T. A high-level, overview of several customer flows, including alternate paths, for the various experiences.
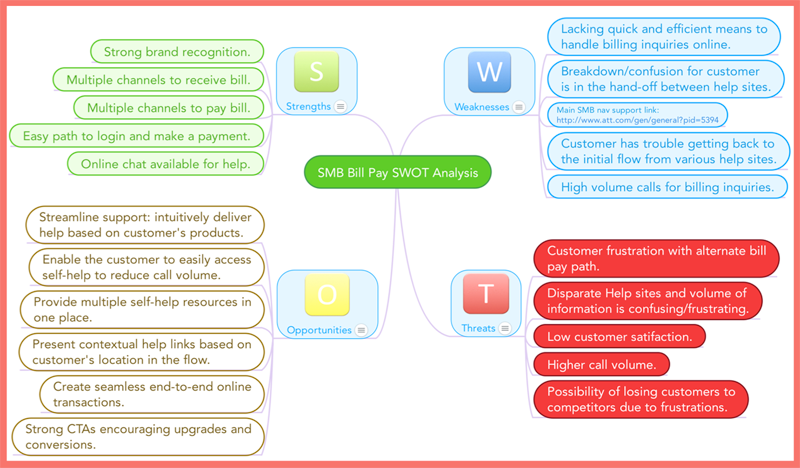
Created for AT&T using Mindmeister. These are Strength/Weaknesses/Opportunies/Treats (SWOT) analyses to assist in determining what fixes should be slated for new projects.